Aircraft Comparative Analysis - Bombardier Challenger 300
In this month’s Aircraft Comparative Analysis- we’ll provide information on a selection of 2011 pre-owned business jets in the $13m-$16m range for the purpose of valuing the Bombardier Challenger 300 aircraft. The current new/pre-owned percentage split for the Challenger 300 is 45%/55%- respectively- according to JETNET records.
Back to Articles
Mike Chase
Michael Chase owns Chase & Associates, an aviation consulting firm specialized in industry product...

Bombardier Challenger 300
In this month’s Aircraft Comparative Analysis- we’ll provide information on a selection of 2011 pre-owned business jets in the $13m-$16m range for the purpose of valuing the Bombardier Challenger 300 aircraft. The current new/pre-owned percentage split for the Challenger 300 is 45%/55%- respectively- according to JETNET records.
Within the scope of this article- we will consider the usual productivity parameters - payload/range- speed and cabin size – and cover current and future market values. The field in this study includes the Gulfstream G200 jet plane.
Brief History
The Challenger 300- formerly known as the Bombardier Continental- is a new-generation aircraft designed to deliver excellent value in the super mid-size business jet category. It was built to offer a transcontinental range and excellent long-range cruise speed without sacrificing airfield performance- an eight-passenger cabin load- and operating costs equivalent to (or better than) other current midsize jets. Ultimately- the Challenger 300 is designed to transport eight passengers 3-100- nautical-miles non-stop with NBAA IFR reserves.
FAA type certification was received in June 2003- with entry into corporate service soon after. This aircraft is RVSM certified- and will start to be replaced by the new model Challenger 350 later in 2014.
Market Share
The Market Delivery percentage share for this field of comparison as of March 2014 was 64% for the Challenger 300 and 36% for the G200 of a total 680 combined aircraft in operation.
Payload and Range
The data contained in Table A is sourced from Conklin & de Decker and also the Business & Commercial Aviation (B&CA) May 2013 issue. As we mentioned in past articles- a potential operator should focus on payload capability as a key factor. The Challenger 300’s ‘Available payload with Maximum Fuel’ at 1-105 lbs is considerably more than that of the Gulfstream G200 (650 lbs). Also- depicted – according to Aircraft Cost Calculator the Challenger 300 burns 270 gallons per hour (GPH)- which is 20 GPH (8%) more fuel than the Gulfstream G200 at 250 GPH.
Cabin Volume
According to Conklin & de Decker- the cabin volumes of the Challenger 300 (at 860 cubic feet) and the Gulfstream G200 (at 868 cubic feet) are basically the same. The Challenger 300 is four feet longer than the Gulfstream G200- while the G200 cabin is taller than the Challenger 300- as depicted in Chart B (illustration by the UPCAST JETBOOK).
Powerplant Details
Powered by two Honeywell HTF7000 engines- the Challenger 300 powerplants each offer 6-826 lbs of thrust. The G200 is powered by a pair of Pratt PW306A engines offering less thrust at 6-040 lbs each.
Cost Per Mile Comparisons
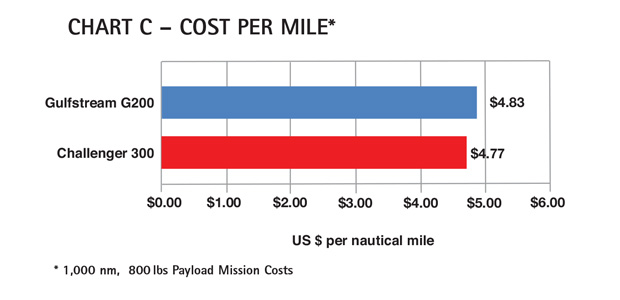
Using data published in the May 2013 B&CA Planning and Purchasing Handbook and the August 2013 B&CA Operations Planning Guide we will compare our aircraft. The nationwide average Jet-A fuel cost used from the August 2013 edition was $6.08 per gallon at press time- so for the sake of comparison we’ll chart the numbers as published.
Note: Fuel price used from this source does not represent an average price for the year.
Chart C details ‘Cost per Mile’- and compares the Challenger 300 to the G200 factoring direct costs- and with each aircraft flying a 1-000nm mission with an 800 pound (four passengers) payload. The Challenger 300 at $4.77 cost per mile is slightly lower than the G200 ($4.83) cost per mile.
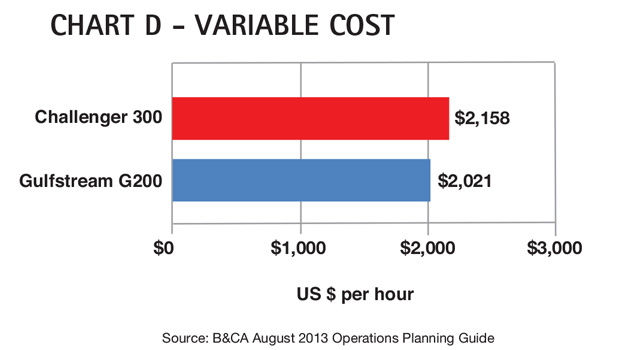
Total Variable Cost Comparisons
The ‘Total Variable Cost’- illustrated in Chart D (defined as the cost of Fuel Expense- Maintenance Labor Expense- Scheduled Parts Expense and Miscellaneous Trip Expense) reveals the Challenger 300- at $2-158- costs more per hour than the G200 at $2-021.
Productivity Comparisons
The points in Chart E center on the same aircraft. Pricing used in the vertical axis is as published in the B&CA August 2013 Operations Planning Guide. The productivity index requires further discussion in that the factors used can be somewhat arbitrary.
v Productivity can be (and it is here) defined as the multiple of three factors:
1. Range with full payload and available fuel;
2. The long range cruise speed flown to achieve that range;
3. The cabin volume available for passengers and amenities.
The result is a very large number so for the purpose of charting- each result is divided by one billion. The examples plotted are confined to the aircraft in this study. A computed curve fit on this plot would not be very tight- but when all business jet aircraft are considered- the “r” squared factor would choose different parameters- but serious business aircraft buyers are usually impressed with Price- Range- Speed and Cabin Size.
After consideration of the Price- Range- Speed and Cabin Size- we can conclude that the Challenger 300- as shown in the productivity index- is highly productive.
The acquisition price of the Challenger 300 is more than the Gulfstream G200- as is the total hourly variable cost – however- although the Challenger 300 offers slightly less cabin height- it offers more length- is less expensive to operate on a cost-per-mile basis- and offers nearly double the available payload of the G200- with maximum fuel- along with a higher long range cruise speed.
Table B contains the average equipped prices from Vref for each aircraft based on 2011 pre-owned prices. The long range speed- cabin volume and maximum payload values are from Conklin and de Decker. The number of aircraft in-operation- percentage ‘For Sale’ and sold (last 12 months) are as reported by JETNET.
Asking Prices vs AFTT/AGE
Chart F- sourced from the Multidimensional Economic Evaluators (MEE) Inc.- (www.meevaluators.com)- shows a Value and Demand chart for the Challenger 300. The current pre-owned market for the Challenger 300 shows 27 aircraft ‘For Sale’. Twelve of these 27 have an asking price- while 15 are inviting offers. We have plotted the 12 with asking prices into our chart.
Left: The Value of Challenger 300s is correlated to their usage as measured by their Total Time in Hours. Note that at least one Observation- No. 9- is more than 2 standard deviations higher than its prediction. We can be confident that Observation 9 is overpriced. It has been on the market for 406 days. The ‘average days on the market’ before a Challenger 300 is sold is 214 days.
Compare- for contrast- Observation 2. In this view- we show it to be only slightly overpriced. The chances are that Observation 2 is correctly priced. (As noted by JETNET in Table B- there were 47 Challenger 300s sold over the past 12 months so it is an active marketplace with ample buyers. However- many factors are to be considered in addition to the asking prices - such as optional equipment- fresh paint and interior- the maintenance performed- etc.)
Right: The Demand Curve on the right is highly correlated (R2=0.99) and it is very shallow as its slope is -0.376. This means that there is more money at the lower end of the market than at the upper end. The demand curve revealed we can separate the data into three bins. The lowest bin has the most quantity ranging in asking prices below $12m. One can read from the total time hours (green) of an aircraft across to the demand curve (red) to find a reasonable asking price.
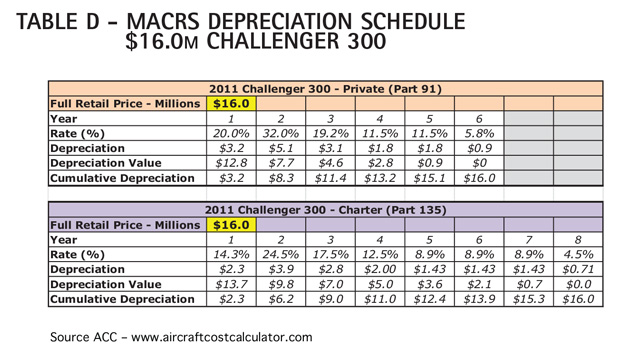
Depreciation Schedule for Business Aircraft
Aircraft that are used in a trade- business- or for the production of income that are primarily operated domestically- and not used in common or contract carriage may be depreciated over a five-year Modified Accelerated Cost Recovery System (MACRS) schedule. Aircraft used in common or contract carriage (e.g.- Part 135) are depreciable under seven-year MACRSs- see Table C.
For illustrative purposes- Table D shows an example of using the MACRS schedule for a 2011 Challenger 300 in Private (Part 91) and Charter (Part 135) operations over five- and seven-year periods assuming a Vref retail value of $16.0 million.
Location by Continent
The major based-at locations for the Challenger 300- per information compiled by JETNET in its STAR reporting system are the United States (73%) and Europe (16%); an aggregate of 89% of the fleet.
Range Comparison
Chart G shows the circle ranges from Shanghai- China- for both the Challenger 300 and Gulfstream G200- as sourced from Aircraft Cost Calculator. The Challenger 300 shows greater range coverage than the Gulfstream G200. [Note: For jets and turboprops- ‘Seats Full Range’ represents the maximum IFR range of the aircraft at Long-Range Cruise with all passenger seats occupied.
ACC assumes NBAA IFR fuel reserve calculation for a 200 nautical mile alternate. The lines depicted do not include winds aloft or any other weather-related obstacles.]
Summary
Within the preceding paragraphs we have touched upon several of the attributes that business aircraft operators value. There are other qualities such as terminal area performance- time to climb performance- and maximum transition altitude levels that might factor in a buying decision- too- however.
Essentially- the Challenger 300 fares well against its competition- so those operators in the market should find the preceding comparison of value. Our expectations are that the Challenger 300 aircraft will continue to do very well in the mid-size jet plane market for the time being.

Mike Chase
Michael Chase owns Chase & Associates, an aviation consulting firm specialized in industry product and market research in the Commercial & Business Aviation sectors.
With over five decades of extensive experience, Michael has worked as a director of special projects for JETNET, LLC; served as Senior Management Consultant for Sabre Holding; and was Director of Market & Sales Research for Gulfstream Aerospace, leading sales and product research, including feasibility and viability studies.
