Bombardier Challenger 605 vs Falcon 2000LX
Large Cabin business jet comparative analysis
Back to Articles
Mike Chase
Michael Chase owns Chase & Associates, an aviation consulting firm specialized in industry product...

In this month’s Aircraft Comparative Analysis, Mike Chase provides information on two popular large cabin business jets for sale, for the purpose of valuing the Bombardier Challenger 605.
Over the following paragraphs, we’ll consider productivity parameters (payload/range, speed and cabin size) and cover current and future market values for the Bombardier Challenger 605. The field in this comparative study includes the Dassault Falcon 2000LX jet.
Brief History
Bombardier introduced its Challenger 604 in 1996 as a major upgrade on the Challenger 601 design, incorporating more powerful engines, larger fuel supply, a completely new undercarriage, structural improvements to its wings and tail, and a new electronic flight instrumentation system.
Ten years later the Challenger 605 was introduced with an avionics and structural upgrade over the Challenger 604 jet. The structural improvements included larger cabin windows, while cockpit instrumentation was updated and electronic flight bag capability added. This model can be visually identified by a new, rounded tailcone. Today there are an aggregated total of 648 Challenger 605 and 604 aircraft in service. The Challenger 605 ceased production in 2014 when Bombardier introduced the Challenger 650.
Worldwide Appeal
There are 279 wholly-owned Challenger 605 aircraft in operation globally. In addition there are three CL605s in shared-ownership and three in fractional-ownership (aggregated total 285 units). Within the operational fleet, 33 (11.8%) are leased, according to JETNET.
By continent, North America has the largest fleet percentage (53%), followed by Asia (22%) and Europe (20%) accounting for a combined total of 95% of the world’s fleet.
Payload & Range
The data contained in Table B are published by Conklin & de Decker, but also sourced from the May 2015 issue of B/CA. As we have mentioned in past articles, a potential operator should focus on payload capability as a key factor. The CL605 ‘Available Payload with Maximum Fuel’ at 1,298 lbs is less than the Falcon 2000LX at 1,590 lbs of payload capability.
In addition, fuel usage by each aircraft is depicted. The Challenger 605 burns more, at 310 gallons per hour (GPH). The Falcon 2000LX by comparison is the more frugal (252 GPH), according to data sourced from Aircraft Cost Calculator.
Cabin Cross-Sections
According to Conklin & de Decker, the CL605 cabin volume is 1,146 cubic feet (length, 28.4 ft.). The Falcon 2000LX is smaller in cabin volume (1,028 cu. ft.) but greater in length at 31.2 ft. Chart A (courtesy of UPCAST JETBOOK) offers a cross-section comparison, and reveals the CL605 has a wider cabin, while the Falcon 2000LX offers a slightly taller cabin.
Range Comparison
As depicted by Chart B and using Witchita, Kansas as the origin point, the CL605 shows almost identical range coverage compared to the Falcon 2000LX, per Aircraft Cost Calculator (ACC) data. Both Aircraft easily cover all of North America non-stop.
Note: For jets and turboprops, ‘Seats-Full Range’ represents the maximum IFR range of the aircraft at Long-Range Cruise with all passenger seats occupied. ACC assumes NBAA IFR fuel reserve calculation for a 200nm alternate. The lines depicted do not include winds aloft or any other weather-related obstacles.
Powerplant Details
The CL605 is powered by two General Electric CF34-3B engines with a thrust rating of 8,929 lbst. The Falcon 2000LX business jet is powered by two Pratt & Whitney Canada PW308C engines each offering less thrust (7,000 lbst).
Cost Per Mile
Using data published in the May 2015 B&CA Planning and Purchasing Handbook and the August 2015 B&CA Operations Planning Guide, we will compare our aircraft. The nationwide average Jet A fuel cost used from the August 2015 edition was $5.25 per gallon at press time, so for the sake of comparison we’ll chart the numbers as published.
Note: Fuel price used from this source does not represent an average price for the year.
Chart C details ‘Cost per Mile’ and compares the CL605 to its competition, factoring direct costs and with each aircraft flying a 1,000nm mission with a 1,600 lbs (eight passengers) payload. The CL605 shows the highest cost per nautical mile at $6.28 compared to $5.56 for the Falcon 2000LX. This is a difference of 72 cents per nautical mile.
Total Variable Cost
The ‘Total Variable Cost’ illustrated in Chart D is defined as the Cost of Fuel Expense, Maintenance Labor Expense, Scheduled Parts Expense and Miscellaneous Trip Expense. The Total Variable Cost for the CL605 computes at $2,772 per hour, 17.2% more than the Falcon 2000LX at $2,365 per hour.
Aircraft Comparison Table
Table C contains the pre-owned prices from Vref Pricing Guide for a 2012 production model of each aircraft. The average speed, cabin volume and maximum payload values are from Conklin & de Decker and Aircraft Cost Calculator, while the number of aircraft in-operation and percentage ‘For Sale’ are as reported by JETNET.
Depreciation Schedule
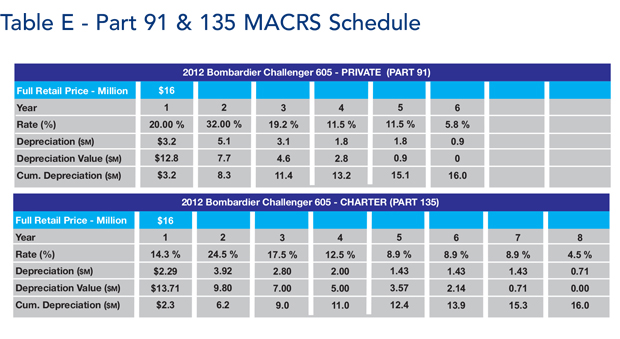
Aircraft that are owned and operated by businesses are often depreciable for income tax purposes under the Modified Accelerated Cost Recovery System (MACRS). Under MACRS, taxpayers are allowed to accelerate the depreciation of assets by taking a greater percentage of the deductions during the first few years of the applicable recovery period (see Table D).
There are a variety of factors that taxpayers must consider in determining if an aircraft may be depreciated, and if so, the correct depreciation method and recovery period that should be utilized. For example, aircraft used in charter service (i.e. Part 135) are normally depreciated under MACRS over a seven year recovery period or under ADS using a twelve year recovery period.
Aircraft used for qualified business purposes, such as Part 91 business use flights, are generally depreciated under MACRS over a period of five years or by using ADS with a six year recovery period. There are certain uses of the aircraft, such as non-business flights, that may have an impact on the allowable depreciation deduction available in a given year.
Table E, meanwhile, depicts an example of using the MACRS schedule for a 2012 Challenger 605 aircraft in private (Part 91) and charter (Part 135) operations over six and eight-year periods, assuming a used retail value of $16m, per Vref Pricing guide.
Asking Prices vs Age, Airframe Total Time & Quantity
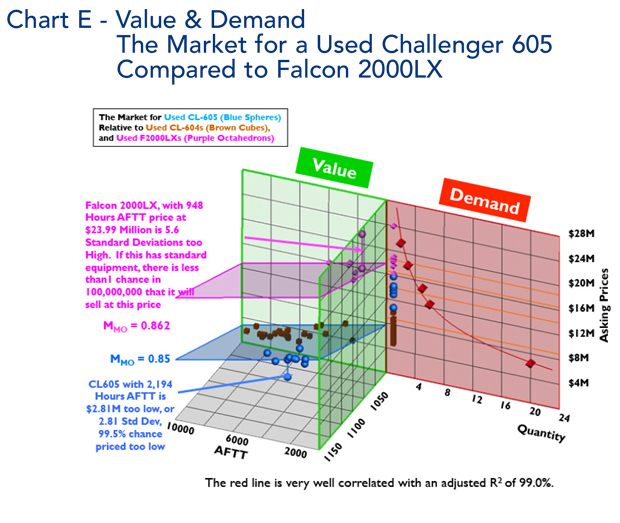
Chart E, sourced from the Multi-dimensional Economic Evaluators Inc. (www.meevaluators.com), shows a Value and Demand chart for the pre-owned CL605. The current pre-owned market for the CL605 aircraft shows a total of 24 aircraft ‘For Sale’ with nine displaying an asking price, thus we have plotted them.
We also added the used Falcon 2000LX and CL604 business jets in our study group with asking prices ranging from $5-24m. The equation that we derived from these asking prices and other criteria used should enable sellers and buyers to compare, and perhaps adjust their offerings, if necessary.
While each serial number is unique, the airframe total hours (AFTT) and age/condition will cause great variations in price. For example, Chart E shows one Falcon 2000LX ’For Sale’ with 948 hours AFTT, and one CL605 with 2,194 hours AFTT. The objective is to determine how to use the demand curve when no asking prices are provided. These two estimated prices suggest that one is underpriced and the other is overpriced. (Of course, the final negotiated price remains a matter between the seller and buyer prior to sale completion).
Demand and Value are on opposite sides of the same Price axis. Thus, the market for used CL605 and Falcon 2000LX jets responds to at least four features: Years, Airframe Total Time (AFTT), Quantity and Asking Prices. Our calculations indicate that each airplane in our study loses about $498 for every hour that it flies.
Productivity Comparisons
The points in Chart F are centered on the same aircraft. Pricing used in the vertical axis is as published in the Vref Price Guide. The productivity index requires further discussion in that the factors used can be somewhat arbitrary. Productivity can be defined (and it is here) as the multiple of three factors:
1. Range with full payload and available fuel;
2. The long range cruise speed flown to achieve that range;
3. The cabin volume available for passengers and amenities.
Others may choose different parameters, but serious business aircraft buyers are usually impressed with Price, Range, Speed and Cabin Size. After consideration of the Price, Range, Speed and Cabin Size, we can conclude that the Challenger 605 displays a high level of productivity.
Popular attributes of the Challenger 605 are a larger cabin volume and significantly lower purchase price compared to the Falcon 2000LX. As mentioned above, while each jet offers similar range, the CL605 exhibits a higher fuel usage (GPH), cost per mile and cost per hour. Compared with the Falcon 2000LX, the CL605 has a lower available payload with full fuel.
Operators should weigh their mission requirements precisely when picking the option that is the best for them.
Maintenance Equity
Exclusive to our online content, Chart G displays the Challenger 605 and depicts the Maximum Maintenance Equity available, based on aircraft age, courtesy of Asset Insight, Inc.
Note: The Maximum Maintenance Equity figure was achieved the day the aircraft came off the production line, since it had not accumulated any utilization toward any maintenance events.
The percent of Maximum Maintenance Equity that an average aircraft will have available based on its age, assumes: Average annual utilization: 420 Flight Hours; and all maintenance being completed when due.
Summary
Within the preceding paragraphs, we’ve touched upon several of the attributes that business aircraft operators value. There are other qualities such as airport performance, terminal area performance, and time to climb that might factor in a buying decision, however.
The Bombardier Challenger 605 jet continues to be very popular today. Those operators in the market should find the preceding comparison useful. Our expectations are that the CL605, which started delivering in 2006 and ceased production in 2014, will continue to do very well on the used jet market for the foreseeable future.
Read More:
- Read the latest Challenger 605 Price Guide with LIVE data and Challenger 605 Jet Buyers Guide.

Mike Chase
Michael Chase owns Chase & Associates, an aviation consulting firm specialized in industry product and market research in the Commercial & Business Aviation sectors.
With over five decades of extensive experience, Michael has worked as a director of special projects for JETNET, LLC; served as Senior Management Consultant for Sabre Holding; and was Director of Market & Sales Research for Gulfstream Aerospace, leading sales and product research, including feasibility and viability studies.
